


Table of contents
PREAMBLE
I have always dream of owning a big house, overlooking the beach in a very nice neighborhood one day but i have put little consideration into how much dollars i will spend in acquiring my dream place. I am sure there are a lot of dreamers like me who have planned how their dream house will be and where it will be located without considering that all the factors they want will affect price of the house and this is the main reason i choose to work on this project when i was looking for a regression project to work on in Kaggle. The insights gotten from this project made me unlearn a whole lot of things i thought was important when looking to buy an apartment in Ames or anywhere in the world.
This project is from a kaggle advanced regression competition for predicting prices of houses in Ames using house features such as Neighbourhood, Zone of the house, Condition and quality of the house, type of sale and condition amongst others. This notebook is among the top 45% score in the competition.
Enough about the preamble, lets dive into it and learn how real estate business works
About Project
This project is a data science and machine learning project. It is about using machine learning to predict House price in Ames. The model is scored using Root Mean Squared Log Error. The trained dataset used for this project has 81 columns which are listed in the data dictionary and 1460 rows (there are columns with missing rows in this dataset
Data Dictionary
The data set and data dictionary used for this project can be found here kaggle.com/competitions/house-prices-advanc..
Import Libaries
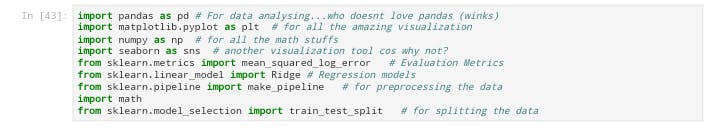
I started by importing the neccessary libaries that are important for this project
Then i imported the dataset and visually and programmatically assessed the data, i noticed that there are missing data, some data types are classified incorrectly i cleaned these issues and I did visualization to derive insights from the dataset.
DATA VISUALIZATIONS
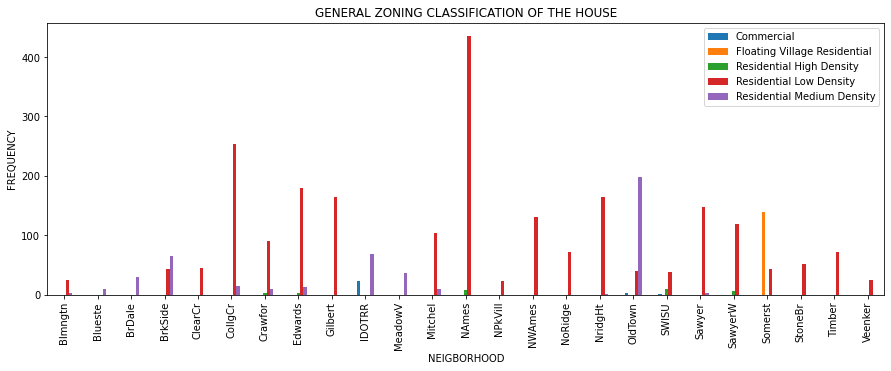
I started by checking the relationship between general zoning classification of the house to be sold and the neighborhood and i found out that most neighborhood that are in the dataset are classified on Residential Low Density
NOTE
General zoning classification of the sale of the house keywords are explained by google here
Commercial Area Zone: it is a real estate intended for use by for-profit-interest businesses such as office complexes, shopping malls, service stations and restaurants
Floating Village Residential: A village residential consist of a single-family dwelling unit constructed on a float, that is moored, anchored, or otherwise secured in waters
Residential High Density: High Density Residential means land to be utilized for residential purposes, including public housing and industrialized units, which does not exceed thirty-two dwelling units per gross acre
Residential Low Density: Low density housing typically refers to residential areas occupied primarily by single-family homes or buildings with a small number of units
Residential Medium Density: Medium Density Residential (MDR) is a category intended to provide compact medium to high density residential development and transitional uses between low density residential uses and higher density residential uses, commercial uses and public and semi-public use areas
As a result of this, i got curious on why over 50% of neighborhood are in residential low density and i perform another analysis to check how much it cost to live in a particular zone, probably that is the reason almost all neighborhoods are in residential low density zone and i was shocked with my findings
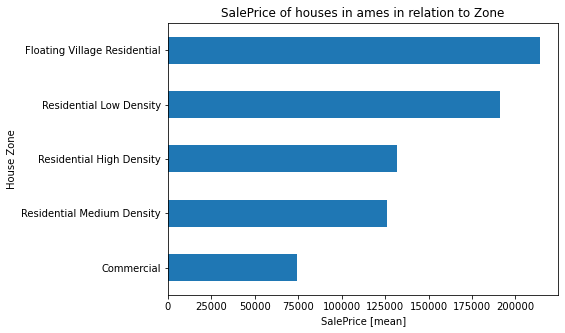
The residential low density zone is the second most expensive zone in Ames Neighborhood. "Why are there a lot of people living in this expensive zone." I thought to myself then i decided to do further research. Human always crave for peace and comfort especially when they want to start their own family and it is at this stage that most people in Ames buy houses. In residential low density zone, There is low level of pollution as compared to other zones except for Floating Village Residential, increased access to undeveloped land, increased area for recreation, and a higher level of privacy and this is probably why almost all the neighborhood have this zone.
Floating Village Residential also has all these features and sometimes, this zone is often better than other zones but the disadvantage is that houses in the zones are very expensive and commuting to and from the neighborhood to another neighborhood is not easy as the houses in this zone are built on water. This zone is reserved for the elite in Ames. From this, I concluded that the most expensive Neighborhood in Ames is Somerset. (When I move to Ames, i am definitely living in this neighborhood as it is giving my dream house vibes)
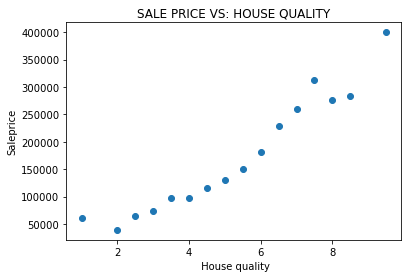
Moving on, I tried to find out if there is any relationship between Home quality and Price of house and i am not surprised that there is in fact a direct positive correlation between the two.
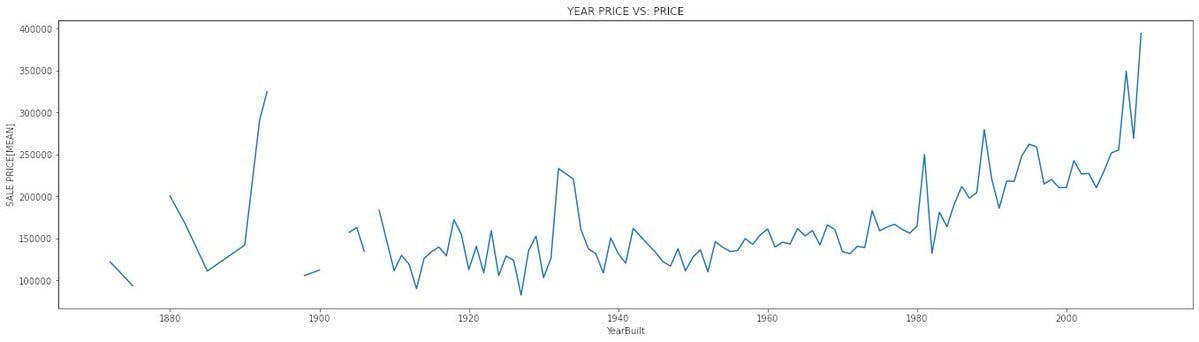
Little to no relationship was found between year built and Sale price of house. This means that the year the house was built does not have effect on the price of the house.
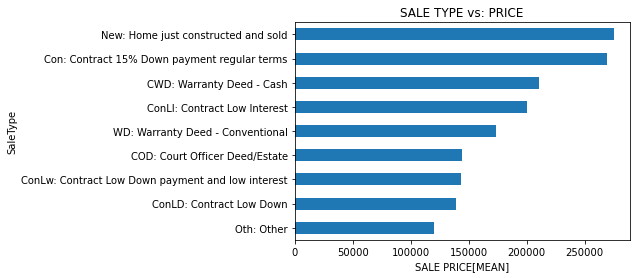
When the relationship between how the house was sold and the price it was sold was looked at, it was discovered that the price of new home, i.e houses that are just constructed and sold are the most expensive followed by houses that 15% down payment was made and payment will be made on regular terms. Houses that are bought by other means are the cheapest.
MACHINE LEARNING
Data Preprocessing
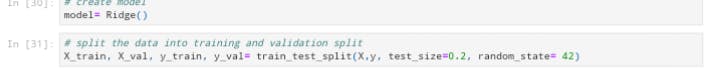
I noticed that there are missing data, which i filled with the mean, There are some data types are classified incorrectly and there are outliers in the dataset and all those issues were cleaned before I used Ridge regression model on the dataset. Pd.dummies was used to convert the categorical features to numerical features, after which i split the data into training and test set.
I removed features that are highly correlated with each other then test_trained_split module from sklearn.model selection was used to split the training data into training and validation split after which i trained the model on the trained split and scored it on the validation split.
Creating Baseline Model
I created a baseline model to check if my model is performing well or not.
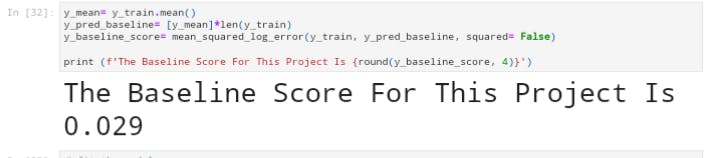
Training and Fitting of Model
I used Ridge Regression Model because it performs well on features that have a lot of categorical data unlike Linear Regression. Ridge regression model generalize well on data that are not straight line, it tries to capture all the data. I fitted and score the model using Root Mean Squared Log Error (RMSLE) and my model performed better than the baseline model
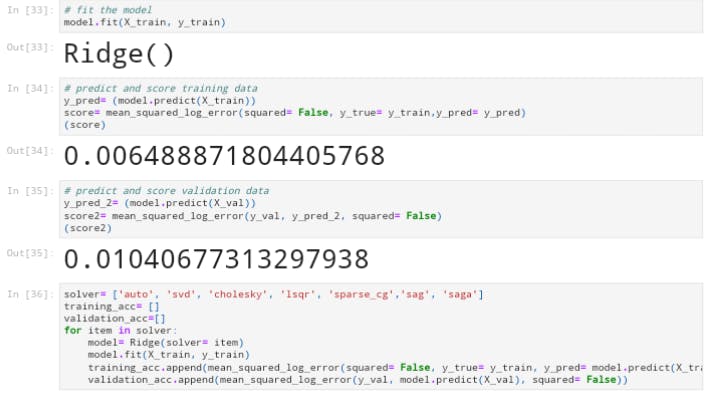
Tuning Model I did a little bit of tuning but the model score was not improving so i will leave it out here but you can look it up in my notebook on github if you wish
Predicting Target Variables I used the model to predict target variable and it scored 0.14425 in the competition which placed me at top 45% position at the time of writing this article
Conclusion
I hope that at the end of this article, you have an idea on the type of neighborhood and house you want to buy when you relocate to Ames or if you are Interested in investing in real estate in Ames, i hope we become neighbors (I have hinted where i will be living when i eventually relocate in this article). But most especially, i hope you had fun reading this article as much as i enjoyed writing it.
Thank you for reading till the end,
Enjoy the rest of your day/night
Stay blessed